Building an example
The following section shows how to build a simple example application using VS Code.
This example prints messages in the TERMINAL window and flashes an LED on the XK-EVK-XU316 board. On other boards with the xcore.ai device it will print the messages but the LEDs may not flash.
When following the steps below, some notification pop-ups may appear in the bottom right corner and can usually be ignored.
If the Microsoft CMake Extension is installed, it should be disabled when using the XMOS XTC Tools extension because it conflicts with the XMOS XCommon CMake Build System integration.
Start VS Code
Go to the Start Menu
Find Visual Studio Code and launch it
Go to the Launch Pad
Select Visual Studio Code
Open a shell
In the shell prompt type
$ code
Select the XTC Tools
The XTC Tools version must be selected using the following steps.
Open the XMOS XTC Tools extension view by pressing the XMOS XTC Tools icon in the Activity Bar
Press the Select XTC Tools button in the WELCOME view shown in the figure below
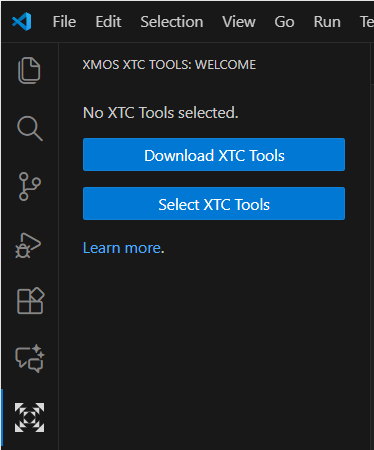
Fig. 4 ‘Select XTC Tools’ button inside the WELCOME view of the XTC Tools extension
A central quick pick menu is shown with the option XTC Tools 15.3.1
Select XTC Tools 15.3.1
The currently selected XTC Tools version is shown in the heading of the XTC Tools view as shown in the figure below
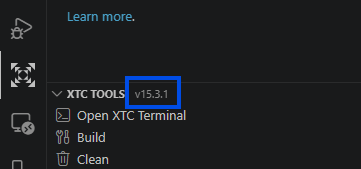
Fig. 5 The currently selected XTC Tools version
Open the XMOS XTC Tools extension view by pressing the XMOS XTC Tools icon in the Activity Bar
Press the Select XTC Tools button in the WELCOME view shown in the figure below
Fig. 6 ‘Select XTC Tools’ button inside the WELCOME view of the XTC Tools extension
A central quick pick menu is shown with the option XTC Tools 15.3.1
Select XTC Tools 15.3.1
The currently selected XTC Tools version is shown in the heading of the XTC Tools view as shown in the figure below
Fig. 7 The currently selected XTC Tools version
Open the XMOS XTC Tools extension view by pressing the XMOS XTC Tools icon in the Activity Bar
Press the Select XTC Tools button in the WELCOME view shown in the figure below
Fig. 8 ‘Select XTC Tools’ button inside the WELCOME view of the XTC Tools extension
A central quick pick menu is shown
Select Browse for XTC Tools Path
A file browser is shown
Use this browser to select the root directory of XTC Tools 15.3.1 installation, which should be named
15.3.1The currently selected XTC Tools version is shown in the heading of the XTC Tools view as shown in the figure below
Fig. 9 The currently selected XTC Tools version
Download an application
Open the XMOS XTC Tools extension view by pressing the XMOS XTC Tools icon in the Activity Bar as shown in the figure below
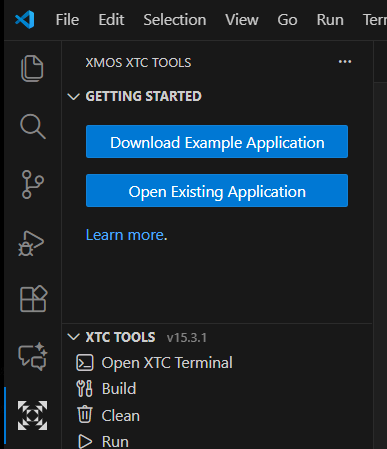
Fig. 10 The XMOS logo in the activity bar on the left opens the XMOS XTC Tools extension view
Press the Download Example Application button in the GETTING STARTED view
Select the item Making an LED glow with Pulse Density Modulation from the central quick pick menu
A file browser is provided. Select a suitable location. On Windows select a directory with a short path, for example
c:\xmos.A progress dialog will be shown in the bottom right corner
VS Code may present a dialog box “Do you trust the authors of the files in this folder?”. Press the button Yes, I trust the authors
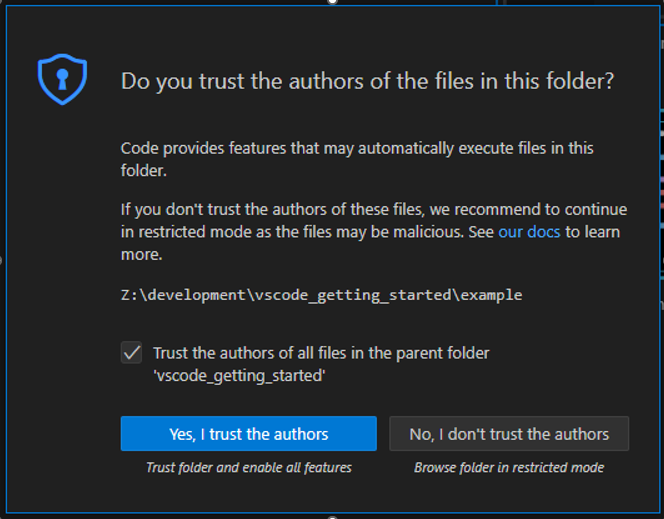
Fig. 11 Press the button Yes, I trust the authors if this dialog appears
Build an application
Open the XMOS XTC Tools extension by pressing the XMOS XTC Tools icon in the Activity Bar
In the XTC TOOLS view, press the Build button as shown in the figure below
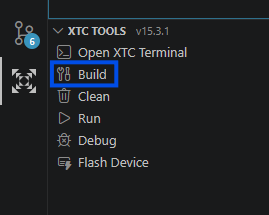
Fig. 12 The build button in the XTC Tools view
The TERMINAL window shows build progress and the message
The terminal process completed successfully.when the build has completed as shown in the figure below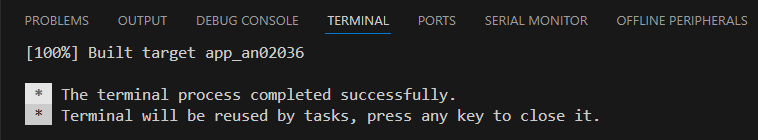
Fig. 13 Build progress is shown in the TERMINAL window
Run an application on a target board
Connect an XMOS XK-EVK-XU316 target board to the host computer as shown in Setup the target board and xTAG. (Other boards with the xcore.ai device may be used to show printed messages, but the LEDs may not change state)
Press the Refresh Devices icon in top-right of the DEVICES view
The xTAG identifier for this board will appear in the DEVICES list
In the XTC TOOLS view, press the Run button
An LED on the target board will alternate from bright to dim
Messages from the target will be printed in the TERMINAL window
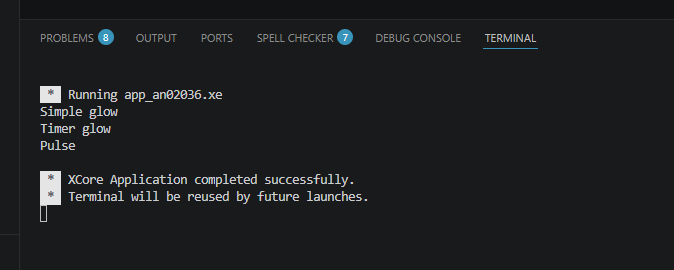
Fig. 14 Messages from the target will be printed in the TERMINAL window
Write the application to the flash device on the target board
In the XTC TOOLS view, press the Flash Device button
A progress dialog will be shown in the bottom right corner of the main VS Code window
The TERMINAL window shows the flash writing progress and the message
The terminal process completed successfully.when the flash writing has completedThe target will be reset and an LED on the target board will alternate from bright to dim
Debug the application on a target board
Set a breakpoint in the source code by clicking in the left margin of the editor window next to a line of code. A red dot will appear to indicate the breakpoint has been set.
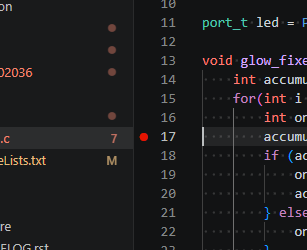
Fig. 15 Setting a breakpoint in the source code
In the XTC TOOLS view, press the Debug button
The application will run until it hits the breakpoint and then pause. The line of code where the breakpoint is hit will be highlighted in the editor window.
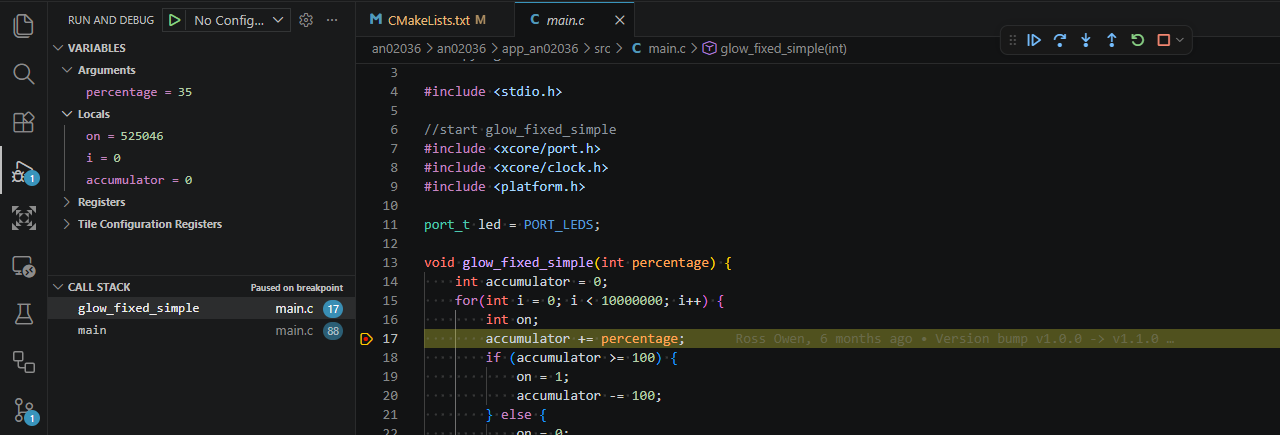
Fig. 16 The target has hit the breakpoint and paused execution
While in the paused state, the call stack is displayed in the CALL STACK view, and registers and variables are displayed in the VARIABLES view.
The application can be stepped through line by line using the Step Over and Step Into buttons in the floating debug toolbar.
The DEBUG CONSOLE can be used to enter XGDB commands for more advanced debugging.
See https://code.visualstudio.com/docs/debugtest/debugging for more information on debugging in VS Code.
Note
If the application has been built without debug information, the warning “No debug information found in executable”, will be displayed,
and the debugging experience will be severely limited. To fix this, open the “CMakeLists.txt” file which defines the build configuration
and add -g to APP_COMPILER_FLAGS, for example:
cmake_minimum_required(VERSION 3.21)
include($ENV{XMOS_CMAKE_PATH}/xcommon.cmake)
project(app_an02036)
set(APP_HW_TARGET          XK-EVK-XU316)
set(APP_DEPENDENT_MODULES  "")

# Note that the -g flag is required to enable debug information
set(APP_COMPILER_FLAGS     -g -report)

set(APP_INCLUDES           src/)
set(XMOS_SANDBOX_DIR       ${CMAKE_CURRENT_LIST_DIR}/../..)
XMOS_REGISTER_APP()
Then rebuild the application.
Using the TERMINAL
The XTC Tools may be used with a command line interface inside the VS Code editor.
In the XTC TOOLS view, press the Open XTC Terminal button
The environment is set up for the use of the XTC command line tools. See Using the command line tools and Command line tools for further details on the XTC command line tools which can be used in this TERMINAL.
Disassembling an application
To view the disassembly of an application, navigate to the executable file for this application in the EXPLORER view and click on it.
The disassembly will be shown in the editor window.
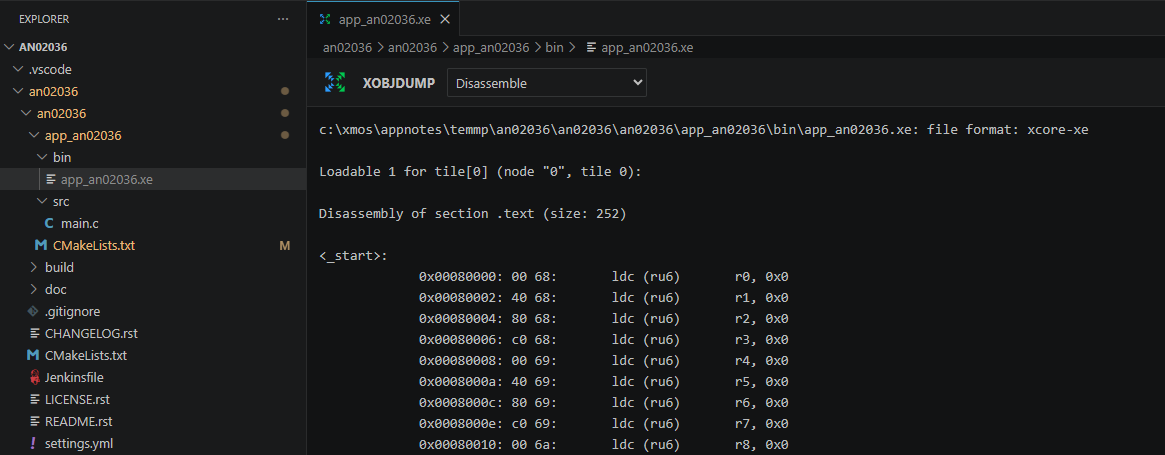
Fig. 17 The disassembly of an application
The drop-down menu at the top of the editor window can be used to view other information contained in the executable file, such as the symbol table.