Configuring an IDE#
Some users may choose to use an Integrated Development Environment to augment their use of the tools. The tools can be integrated to varying degrees with a number of common user-supplied IDEs.
The instructions given below are simply suggestions; there are many ways of integrating the tools with even a single IDE, and the user is encouraged to experiment to suit their workflow.
Configuration common to all IDEs#
Creation of project content#
In order to reduce the amount of repetition later in this document, we define a set of example projects which will be used as a basis for each specific IDE.
Create two example projects:
$ mkdir -p projects/single-tile
$ mkdir -p projects/switch-setup
Within projects/single-tile:
Create
main.cas per A single-tile programCreate the following three bash scripts:
#!/bin/bash

CWD=`pwd`
xcc -target=XCORE-200-EXPLORER -g $CWD/main.c
#!/bin/bash

xrun --io a.xe
#!/bin/bash

xgdb a.xe
Within projects/switch-setup:
Create
multitile.xcandmain.cas per Communicating between tilesCreate three bash scripts as above, but with a slight modification to
build.sh:#!/bin/bash CWD=`pwd` xcc -target=XCORE-200-EXPLORER -g $CWD/mapfile.xc $CWD/main.c
You might later choose to customise these bash scripts; they will act as placeholders for now.
Choice of build System#
Users of the tools may use any build system. The examples below demonstrate use of deliberately basic “build system” such that the examples are not dependent on installation of a build system.
Integration of “Run” and “Debug” functionality#
The current architecture of the XRUN and XGDB tools is such that integration with 3rd-party IDEs is limited to terminal operation only. The guidance below therefore “integrates” the run and debug functionality into the terminal window of the respective IDE.
Visual Studio Code#
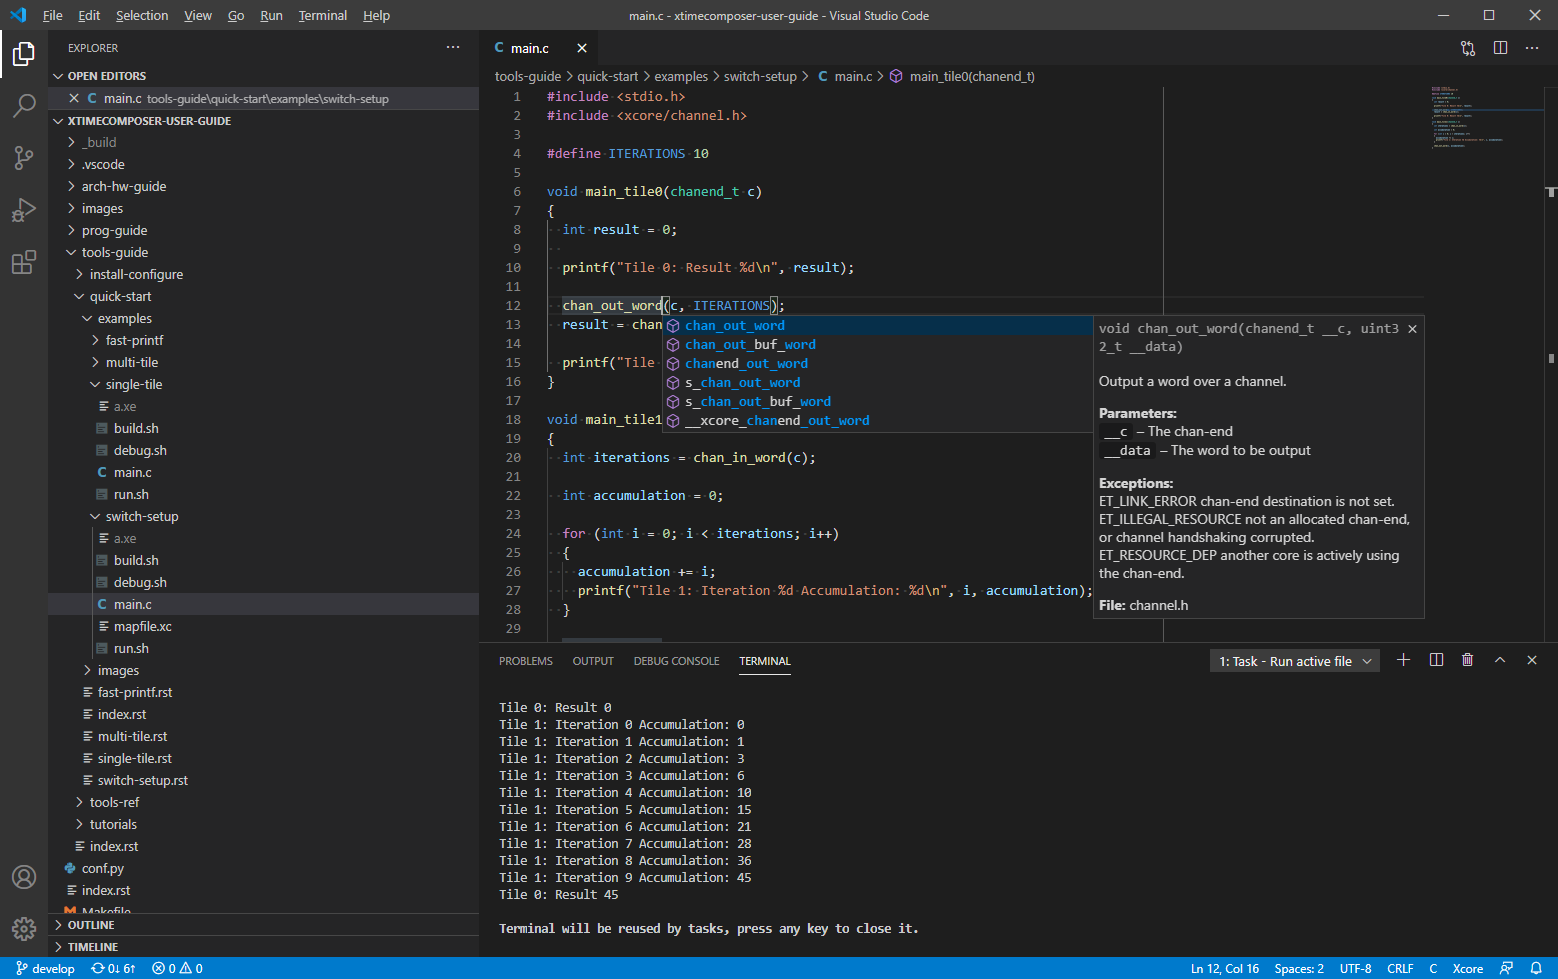
Fig. 2 Example of tools plugged into VS Code#
Pre-requisites#
Install Visual Studio Code.
Install the C/C++ extension for VS Code.
Ensure the command line environment is working.
Create the example project content
Start VS Code and check the environment#
From a bash terminal where the command line environment is working, start VS Code such that it can see both projects within its workspace:
$ cd projects
$ code .
Check that the tools are available within VS Code. Select and check that the following command gives the expected results:
$ xcc --version
Configure VS Code#
If not already present, create a folder .vscode within the
projects folder and, within it, create two files:
{
    "version": "2.0.0",
    "tasks": [
        {
            "label": "Build active file",
            "type": "shell",
            "command": "bash",
            "args": [
                "./build.sh"
            ],
            "options": {
                "cwd": "${fileDirname}"
            },
            "problemMatcher": [
                "$gcc"
            ],
            "group": {
                "kind": "build",
                "isDefault": true
            }
        },
        {
            "label": "Run active file",
            "type": "shell",
            "command": "bash",
            "args": [
                "./run.sh"
            ],
            "options": {
                "cwd": "${fileDirname}"
            },
            "problemMatcher": []
        },
        {
            "label": "Debug active file",
            "type": "shell",
            "command": "bash",
            "args": [
                "./debug.sh"
            ],
            "options": {
                "cwd": "${fileDirname}"
            },
            "problemMatcher": []
        }
    ]
}
{
    "version": 4,
    "configurations": [
        {
            "name": "Xcore",
            "includePath": [
                "${workspaceFolder}/**"
            ],
            "defines": ["XSCOPE_IMPL"],
            "compilerPath": "${XMOS_TOOL_PATH}/bin/xcc",
            "cStandard": "gnu11",
            "cppStandard": "gnu++14",
            "intelliSenseMode": "clang-x64",
            "compilerArgs": [
                "-save-temps"
            ]
        }
    ]
}
Use VS Code#
For the projects/single-tile application:
Open
projects/single-tile/main.c. With this file active, use the keyboard shortcut Ctrl+Shift+B to build the application.To run the application without debugging, hit Ctrl+P, then start typing
task Run. When Run active file is highlighted, press enter. The application output will appear in the Terminal view.To debug the application, hit Ctrl+P, then start typing
task Debug. When Debug active file is highlighted, press enter. An interactive debug session will begin in the Terminal view. When finished debugging, be sure to issuequitto end the session.
To build, run and debug the projects/switch-setup application, carry out
the same actions, but first make sure that projects/switch-setup/main.c
is the active file.
You may check that VS Code’s ‘Intellisense’ is working correctly by hovering the
mouse over chan_out_word in projects/switch-setup/main.c.
Further suggestions#
With the tools now integrated into VS Code, you might try:
Setting up some keyboard shortcuts for the Run and Debug tasks
Adding the XSCOPE example to your projects folder and using the WaveTrace VS Code extension to view the generated .vcd file.
Eclipse#
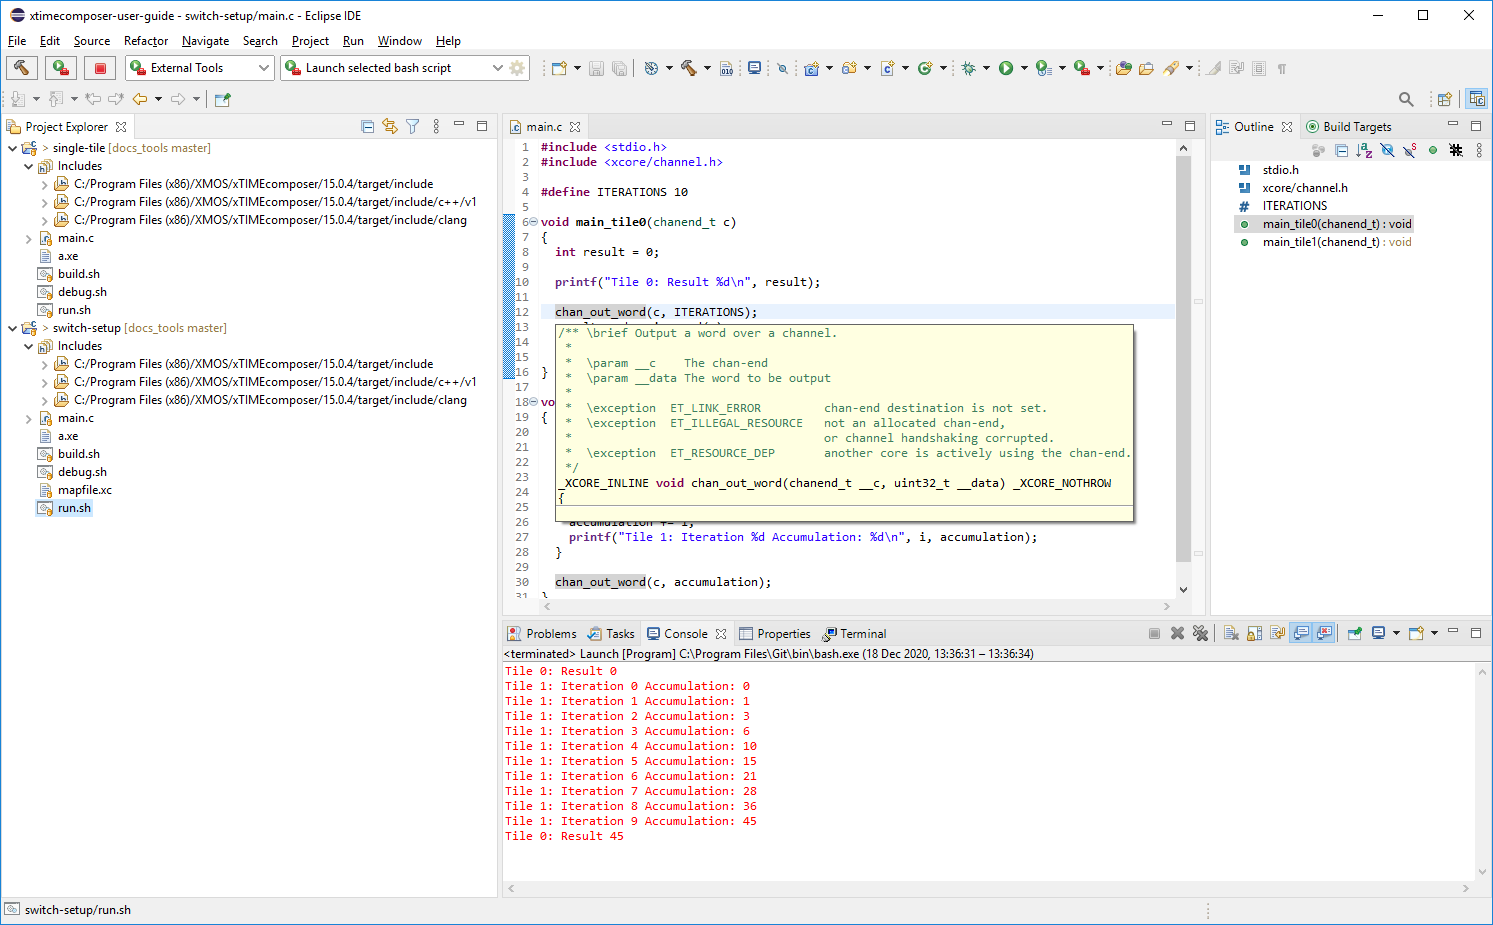
Fig. 3 Example of tools plugged into Eclipse#
Pre-requisites#
Install Eclipse CDT.
Ensure the command line environment is working.
Create the example project content
Start Eclipse and check the environment#
From a bash terminal where the command line environment is working, start Eclipse:
$ eclipse
Create a new Eclipse workspace in the projects folder you have created.
Next check that Eclipse can access the tools. Open a Terminal window using . Within the window, click the “Open a Terminal” icon and launch a bash terminal. Confirm that the following command produces the expected results:
$ xcc --version
Configure Eclipse#
Follow these steps to import the single-tile project content you’ve
already created into your Eclipse workspace:
Navigate to
Project Name:
single-tileExisting Code Location: “Browse” to
projects/single-tileToolchain for Indexer Settings: Select
Cross GCC(Untick “Show only…” if not visible)Click “Finish”
This will create the single-tile project in the “Project Explorer”
window. We next make some adjustments (because we’re not actually using GCC as
previously selected):
Right-click the
single-tileproject and select “Properties”Navigate to
Select the “Providers” tab
Adjust the “Command to get compiler specs” to read:
xcc $FLAGS -march=xs2a -E -P -vv -dD "$INPUTS"Click “Apply and Close”
These adjustments allow the Eclipse source code indexer to find the correct include files within the toolkit. Confirm this is working in two ways:
Within the “Project Explorer” window, navigate to . Confirm that the path to the contained include files is as expected.
Open the file
main.c. Confirm that the “Problems” window is empty (which indicates that indexing has completed successfully).
We now make further modifications because, in this example, we’re not going to
use a Makefile as previously selected:
Right-click the
single-tileproject and select “Properties”Navigate to and select the “Builder Settings” tab
Untick “Use default build command” and set “Build command” to
bash build.shClick “Apply and Close”
Repeat these steps for the switch-setup project.
We now configure Eclipse for running and debugging:
Navigate to
Click the icon “New launch configuration”.
Select the “Main” tab and enter the following details:
Name:
Launch selected bash scriptLocation: “Browse File System” to locate bash executable
Working Directory:
$container_locArguments:
$selected_resource_name
Select the “Build” tab and select “The project containing the selected resource”
Click “Apply”
Click “Close”
Use Eclipse#
Within the single-tile project:
To build:
Select any file within the project
Click on the “Build” icon
To build and run:
Select
run.shwithin the projectNavigate to
To build and debug:
Select
debug.shwithin the projectNavigate to
Now try the same within the switch-setup project.
xTIMEcomposer Studio#
Integration of the XTC toolchain with the xTIMEcomposer Studio IDE packaged with previous tools releases is not recommended. Developers desiring a similar IDE experience should follow the instructions for Eclipse.